Thursday 8 August 2013

How is the Eurozone Doing? Still Extremely Fragile.

As EUROSTAT publishes new data, we update our quarterly analyses of the Complexity and Resilience of the Eurozone. The situation as of Q4 2012 is as follows:

Complexity. A growing economy becomes necessarily more complex (see black curve below). However, at the same time it is important to stay away from the so-called critical complexity (red curve). Before the crisis has crippled the global economy things are proceeding relatively low although the two curves were already quite close. Since complexity has peaked in early 2008 there has been a persistent reduction of complexity, equivalent to the loss and destruction of what has been created in the past. In mid-2011 the situation has stabilised but still dangerously close to critical complexity. In other words, the situation is that of extreme fragility. This means that the system is not in the condition to absorb shocks or contagion without major consequences. Moreover, there is no clear signal of recovery apart from the mild growth of complexity in the second half of 2012.


It is interesting is to see complexity for the core 15 EU member states and the 12 which have joined later (for Croatia there is insufficient data to incorporate it in the analysis). It appears that the group of 15 (red curve below) are indeed on a road to mild and sustained recovery. The remaining 12 nations are still on a downward path with indications of stabilisation.


However, what counts is the system as a whole. The resilience (robustness) of the EU27 system is indicated below. There is a mild upward trend but the value of resilience is below 50% which reflects extreme fragility. Certainly the system does not contain triple-A components, as the Rating agencies claim.


Based on the above plots one can infer how the crisis has so far destroyed approximately ten years of growth. And it's not over yet. The oscillatory character of the curves over the past 12-18 months suggests a state of prolonged stagnation. The next 3-4 quarters will show for sure.


www.ontonix.com


You can run the above analysis yourself here: www.rate-a-business.com


Wednesday 7 August 2013

In a Globally Crippled Economy, Can There Be AAA-rated Countries?


According to S&P, the following countries have been rated AAA (see complete list of country ratings here):

 United Kingdom


 Australia


 Canada


 Denmark


 Finland


 Germany


 Hong Kong


 Liechtenstein


 Luxembourg


 Netherlands


 Norway


 Singapore


 Sweden


  Switzerland        


Nine of the above countries are from Europe, the area of the globe that has been hit the hardest by recession and public debt issues.

Because of globalisation we are all on the same boat - every economy is connected to (almost) every other economy. This is what is meant by interdependency. The global economy forms a densely connected network through which information travels at the speed of the Internet. So, if the economy is a global mess - we're actually talking of a meltdown, which sounds pretty dramatic - can there exist triple-A rated economies? In theory yes. In theory anything is possible, nothing is impossible. But that of course depends on the theory.

How can a system that is severly crippled, impregnated with trillions and trillions of derivatives and toxic financial products, of which nobody knows the total amount in circulation (some say 10 times, some say 15 times the World's GDP - the uncertainty is high enough to reflect the severity of the problem.) contain so many large triple-A economies. Does that really make sense? In a state of metastacizing economic crisis how can this be explained?

The problem is quite simple really. Credit Rating Agencies are rating the wrong thing. They rate the Probability of Default (PoD) of a country (or a corporation). Instead, they should be rating other  more relevant characteristics of an economy, such as its resilience and complexity. Resilience (fragility) has nothing in common with performance. You can perform extremely well, and think you're like this:


but in reality you're like this:


Wouldn't you want to know? Isn't survival a nice reflection of success? More soon.


www.rate-a-business.com


www.ontonix.com


Monday 5 August 2013

Complexity Maps Get a Facelift.

Ontonix has announced today the release of version 6.0 of its flagship software system OntoSpace. The full Press Release is available here.

One of the salient new features is the new display of Business Structure Maps, illustrated below. One may notice that now each node of the map has different dimensions. These are computed based on the Complexity profile, i.e. size is function of the node's importance (footprint) on the entire system. This allows to focus immediately on the important issues.


This is what the above map looked like in the previous version released in 2010.


But there is more. In very large cases, things become difficult to grasp (this happen not only with OntoSpace but in life in general). Consider, for example, the Business Structure Map of the EU (each group of nodes, depicted either in blue or red - alternating colours are used to enables users to distinguish the various groups - corresponds to a country).


Not very clear is it? In fact, the map has 632 nodes which are interconnected by 41671 rules! How do you go about analysing that? Well, you can't. For this reason OntoSpace v6.0 supports the so-called Meta-maps, which are obtained from the above map by grouping all variables into "meta-nodes" and also by condensing all the interactions between meta-nodes into only one link. The result looks like this:


This is of course much more clear. A Meta-map is a nice way to represent a system of systems whereby each node is a system with various nodes (variables). More on OntoSpace v6.0 soon.


www.ontonix.com


www.rate-a-business.com


Sunday 4 August 2013

Rating the Rating Agencies. And those who control them.


Who rates the Rating Agencies? Who rates those that award triple-A ratings to companies that fail the day after or to junk bonds and toxic financial products that lead to global economy meltdown? The answer: nobody. Who controls them? Huge investment funds, such as BlackRock, for example. If you control a rating agency and if you control publicly listed companies the circle is closed. An excellent book on the subject is "The Lords of Ratings" by P. Gila and M. Miscali.

Ontonix provides quarterly ratings of the resilience of corporations, banks, national economies and systems thereof. We also rate rating agencies. One in particular: Moody's. Here is their latest resilience rating:


Which is equivalent to BBB-

And here is the rating of one of the investment funds that controls Moody's, BlackRock:


They get a resilience rating of 83%, which corresponds to an AA. Surprising? Not really.


www.ontonix.com


www.rate-a-business.com


Saturday 3 August 2013

A Structured Look at Cellular Automatons


From the Wikipedia: A cellular automaton is a discrete model studied in computability theory, mathematics, physics, complexity science, theoretical biology and microstructure modelling. It consists of a regular grid of cells, each in one of a finite number of states, such as "On" and "Off" (in contrast to a coupled map lattice). The grid can be in any finite number of dimensions. For each cell, a set of cells called its neighbourhood (usually including the cell itself) is defined relative to the specified cell. For example, the neighbourhood of a cell might be defined as the set of cells a distance of 2 or less from the cell. An initial state (time t=0) is selected by assigning a state for each cell. A new generation is created (advancing t by 1), according to some fixed rule (generally, a mathematical function) that determines the new state of each cell in terms of the current state of the cell and the states of the cells in its neighbourhood. For example, the rule might be that the cell is "On" in the next generation if exactly two of the cells in the neighbourhood are "On" in the current generation, otherwise the cell is "Off" in the next generation. Typically, the rule for updating the state of cells is the same for each cell and does not change over time, and is applied to the whole grid simultaneously, though exceptions are known.

We have measured the complexity and extracted the complexity map of a few cellular automatons which may be found here and are illustrated in the image below:


While  humans are good at recognising patterns and structure, rapid classification of patterns in terms of their complexity is not easy. For example, which is more complex in the above figure, Rule 250 or Rule 190? The answer is below.


Rule 30


Rule 54


Rule 62


Rule 90


Rule 190


Rule 250


It appears that Rule 250 Automaton is the most complex of all (C = 186.25) , while the one with the lowest complexity is Rule 90 (C = 64.31). Not very intuitive, is it?  Intuition is given only to him who has undergone long preparation to receive it (L. Pasteur).


www.ontonix.com


Friday 2 August 2013

Correlation, Regression and how to Destroy Information.


(The above image is from an article by Felix Salomon - 23/2/2009).
When a continuous domain is transferred onto another continuous domain, the process is called transformation

When a discrete domain is transferred onto another discrete domain, the process is called mapping

But when a discrete domain is transferred onto a continuous domain, what is the process called? Not clear, but in such a process information is destroyed. Regression is an example. Discrete (often expensive to get) data is used to build a function that fits the data, after which the data is gently removed and life continues on the smooth and differentiable function (or surface) to the delight of mathematicians. Typically,  democratic-flavoured approaches such as Least Squares are adopted to perpetrate the crime.

The reason we call Least Squares (and other related methods) "democratic" (in democracy everyone gets one vote, even assassins who get re-inserted into society, just as respectful hard-working and law-observing citizens) is that every point contributes to the construction of the mentioned best-fit function in equal measure. In other words, data points sitting in a cluster are treated equally with dispersed points. All that matters is the vertical distance from the sought best-fit function.

Finally, we have the icing on the cake: correlation. Look at the figure below, depicting two sets of points lying along a straight line.


The regression model is the same in each case. The correlations too! But how can that be? These two cases correspond to two totally different situations. The physics needed to distribute points evenly is not the same which makes them cluster into two groups. And yet in both cases stats yields a 100% correlation coefficient without distinguishing between two evidently different situations. What's more, in the void between the two clusters one cannot use the regression model just like that.  Assuming continuity a-priori can come at a heavy price.

Clearly this is a very simple example. The point, however, is that not many individuals out there are curious enough to look a bit deeper into data (yes, even visually!) and ask basic questions when using statistics or other methods.

By the way, "regression" is defined (Merriam Webster Dictionary) as "trend or shift to a lower or less perfect state". Indeed, when you kill information - replacing the original data with a best-fit line - this is all you can expect.


Thursday 1 August 2013

Complexity, drug toxicity and drug design.


As the patents on many drugs, which have been launched in the 1990s, will soon expire, the pharmaceutical industry finds itself at a turning point in its evolution, particularly as far as research and development are concerned. As the pipelines of new products are shrinking, the exposure of many companies is increasing. This will surely hurt revenue in mid and long term. Further pressure comes from an increasingly turbulent economy, shareholders, greater regulatory burden and rallying operating costs, not to mention growing R&D costs. It is the high clinical development costs, in conjunction with shrinking drug discovery rates that are leading to a decline in the productivity in the pharmaceuticals industry. Moreover, during the last decade, R&D productivity has decreased. But even though emerging technologies have enabled companies to develop multiple parallel options, and to test numerous compounds in early stages, such techniques are effective only when there exist databases of candidates as well as drug evaluation criteria. An important improvement is expected in establishing new methods for identifying unwanted toxic effects in early development phases, as well as reducing the late-stage failure rate. Bio-informatics and biomarkers are expected to play an important role.

However, independently of new technologies, and in order to adapt, the pharmaceutical industry must re-think its current business model which appears to be unsustainable in a rapidly changing and demanding market. Innovative medicines will be in demand, as the need for more personalised treatment grows for an quickly growing and fragmented population. In fact, as diagnosis methods improve, the need for more personalised and focused drugs will be inevitable. Pharmaceutical companies must transition from the old block-buster model to a more fragmented and diversified offering of products. It appears, therefore, that the economical sustainability of the pharmaceutical industry hinges on innovation.

A major concern shared by all drug manufacturers is that of drug toxicity. A candidate molecule under investigation must be validated on animals before authorisation for trials in humans is granted. If these preclinical studies show good results, clinical trials with healthy volunteers follow. These have the scope of studying drug efficacy and excluding the presence of toxic effects. Following numerous trials on patients with the targeted disease provide a statistical description of the drug efficacy. There exist essentially two approaches to drug toxicity determination: knowledge-based and the QSAR (Quantitative Structure Activity Relationship) rule-based models, which relate variations in biological activity and molecular descriptors. Evidently, any expert of rule-based system will see its efficacy bounded by the quality and relevance of the employed rules. Because of the inability to predict successfully drug toxicity, drug manufacturers report billion-dollar losses every year.

We wish to formulate a conjecture in relation to drug toxicity: the toxic effects of a molecule are proportional to its complexity. In other words, we suggest that a more complex molecule has greater potential to do damage and over a broader spectrum and that higher complexity may also imply greater capacity to combine with other molecules. The underlying idea is to use complexity as a ranking and risk-stratification mechanism for molecules.

Over the last decade, Ontonix has been developing and validating a novel approach to measuring complexity. The metric is function of structure, entropy, data granularity and coarse-graining. It has been used successfully as an innovative risk-stratification and crisis-anticipation system in economics, medicine and engineering. The metric possesses the following properties:
  • The existence of a lower and upper bound. The upper bound is known as critical complexity.
  • In the vicinity of its lower complexity bound, a generic dynamic system behaves in deterministic fashion.
  • In the vicinity of its critical complexity, a system possesses a very high number of potential behavioral modes and spontaneous mode-switching occurs even in the presence of injection of very small amounts of energy.
  • A large number of components is not necessary to lead to high complexity. Systems with a large number of components can be considerably less complex than systems with a very small number of components. In essence, complicated does not necessarily imply complex.
Based on molecular modelling and molecular simulation techniques (Monte Carlo Simulation), one may readily measure the complexity of compounds and use this measure to classify and rank them. In other words, we suggest to use complexity as a “biomarker”. A simple 
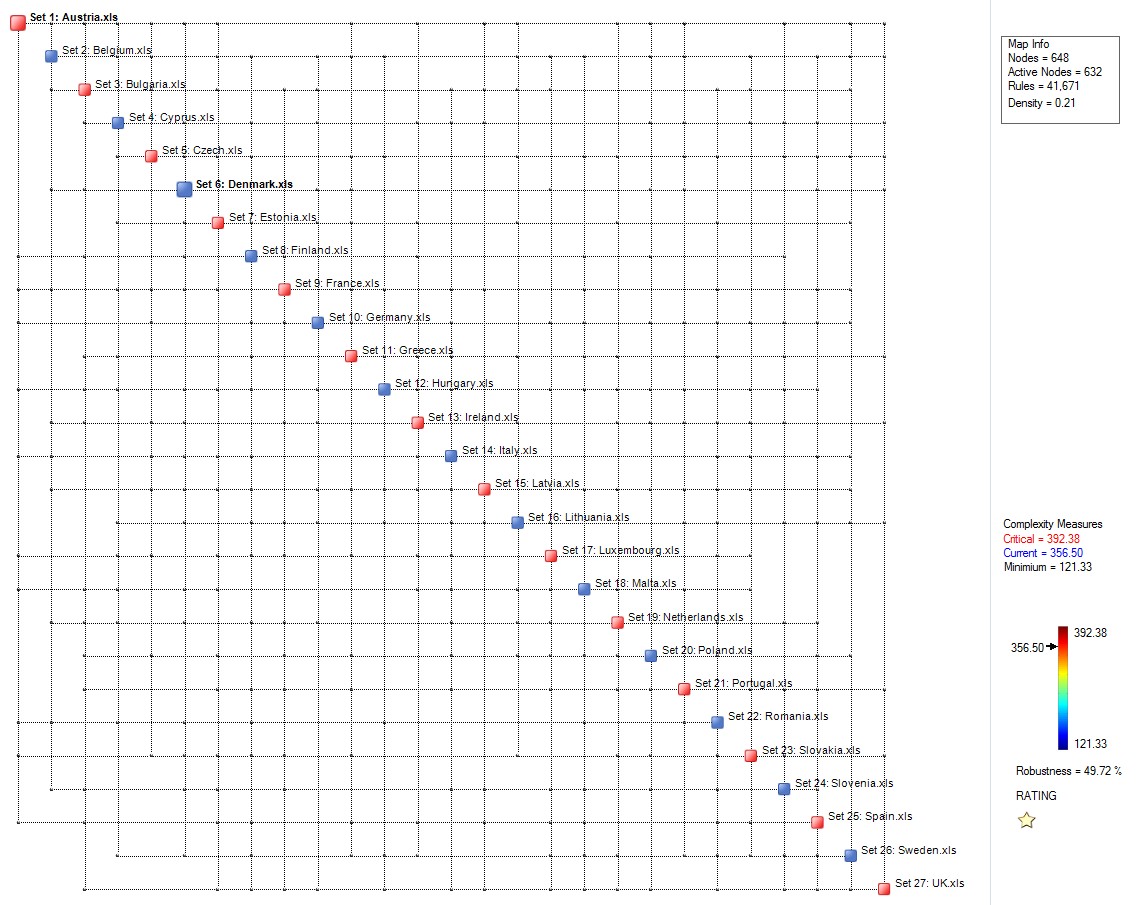
example of the concept is illustrated below, where two so-called Process Maps are shown. Each map is determined automatically by OntoSpace™. Such maps represent the structural properties of a given system, whereby relevant parameters are aligned along the diagonal and are linked by means of connectors (blue dots) which correspond to significant rules. Critical parameters – shown in red – correspond to hubs. The map on the left corresponds to a system with 94 rules and has a complexity of 28.4. The one on the right exhibits 69 rules and a complexity of 19.2. Supposing that both maps correspond to two candidate drugs for the same target disease, the one of the right could correspond to a potentially less toxic candidate. As mentioned, this is a conjecture and needs to be verified.


Clearly, the logic is that if one can perform a given task with a less complex solution, that is probably a better solution. However, we also suggest that substances which function in the proximity of their corresponding critical complexities are globally less robust and, potentially, more toxic. Therefore, a higher value of complexity does not necessarily imply a worse alternative – it is ultimately the relative distance to the corresponding critical complexity which may turn out to be a better discriminant.